Understanding the Data Navigator
The images below display the Industry Data Navigator interface with numbered labels corresponding to each functional component. The interface is organized into two main sections: the Data Browser (upper portion) and the Multi-Series Viewer (lower portion). We've structured the reference information to match this organization, with separate expandable sections for each area and numbered descriptions that correspond directly to the labels in the image.
Click the "Data Browser Components" toggle to access descriptions of the upper interface elements (components 1-16), which help you explore and visualize individual data series. Click the "Multi-Series Viewer Components" toggle to learn about the lower interface elements (components 17-24), which allow you to build and customize comparative visualizations.
Data Browser Components
Main Browser Components
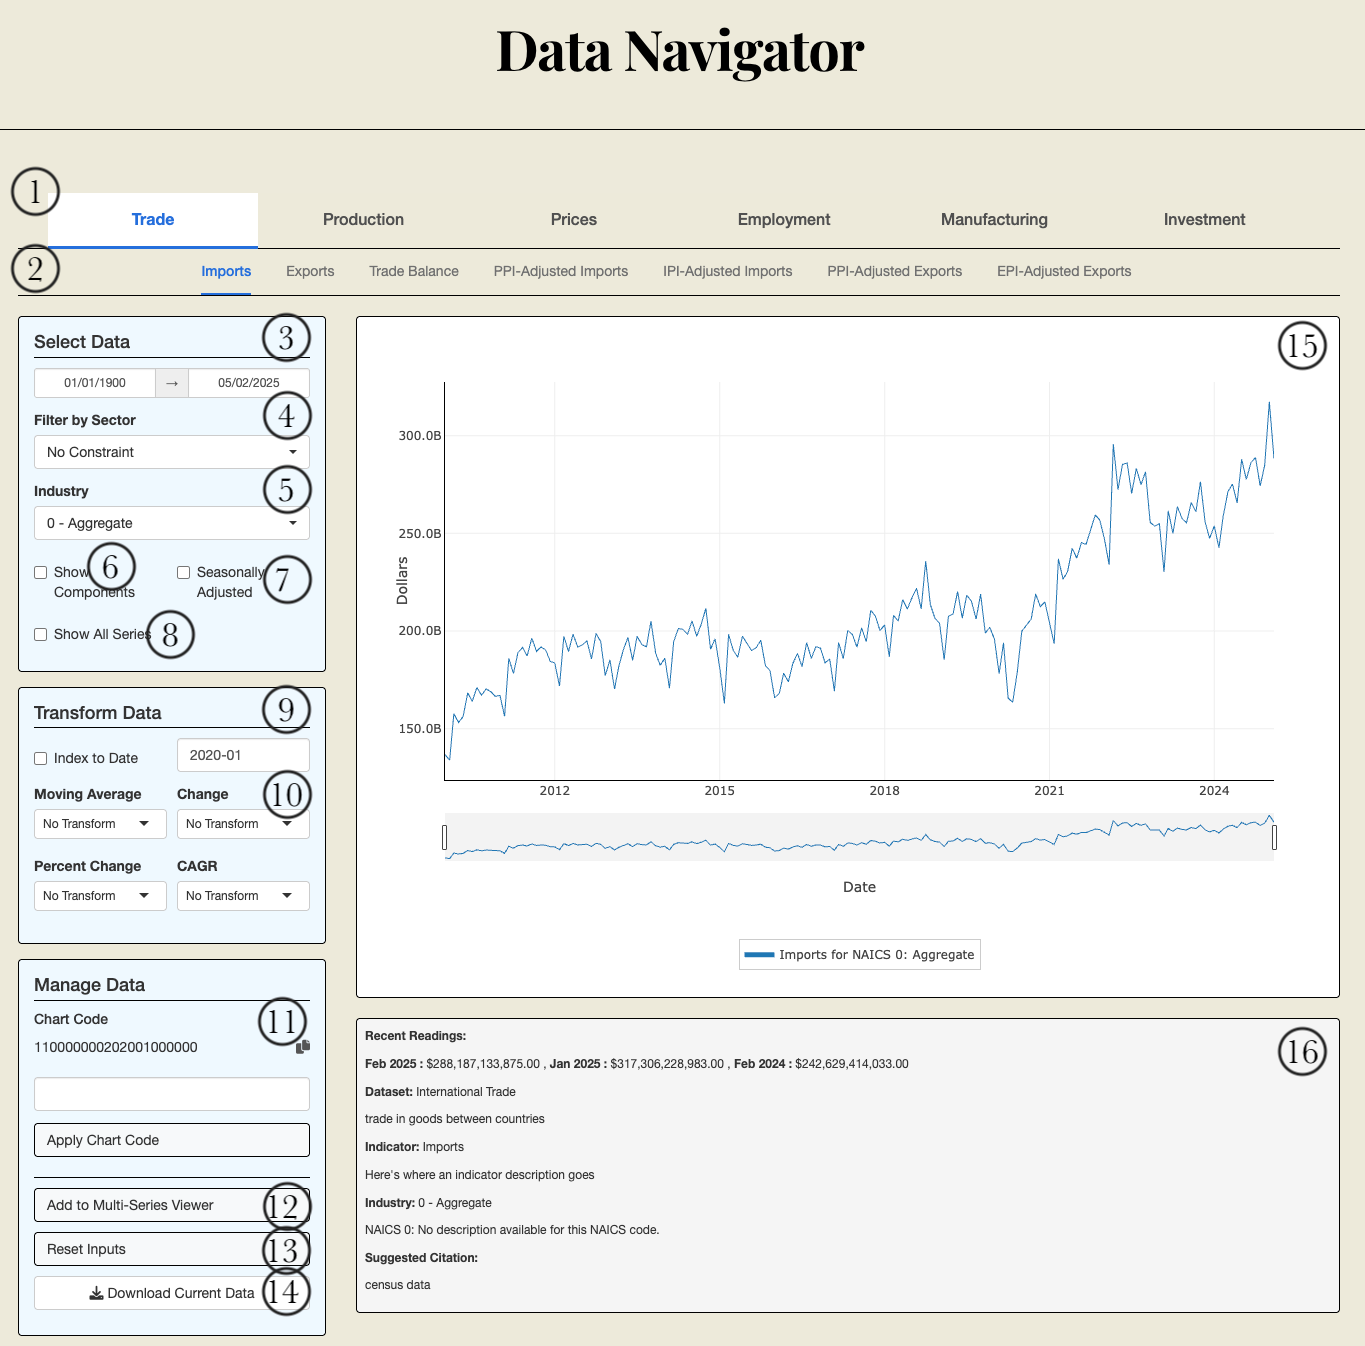
1. Main Navigation Bar This navigation bar contains six main dataset categories that users can select from:
- International Trade
- Production and Capacity
- Price Indices
- Current Employment Statistics
- M3 Manufacturers Shipments, Inventories & Orders
- Investment
Each category represents a distinct collection of economic data organized by measurement purpose. Select a tab to determine which sub-navigation options become available.
2. Sub-Navigation Bar This secondary navigation bar displays indicator options specific to the selected main dataset category. For example:
- When "International Trade" is selected: Imports, Exports, Trade Balance, PPI-Deflated Imports, etc.
- When "Production and Capacity" is selected: Industrial Production, Capacity Utilization, etc.
Select a sub-tab to specify the precise economic indicator you wish to visualize. This selection determines the type of economic data displayed in your charts.
Data Selection Panel
3. Date Range Selector This input allows you to specify the time period for analysis. It consists of a start date and end date field with an interactive calendar picker.
Select:
- Start date: The earliest date for your data view
- End date: The latest date for your data view
The visualization will only display data points that fall within this specified range, allowing you to focus on specific time periods of interest.
4. Filter by Sector Dropdown This dropdown allows you to narrow your industry options by filtering to a specific 3-digit NAICS sector code.
Select a specific NAICS sector to see only industries within that classification, or "No Constraint" to view all available industries. This helps streamline your industry selection process when working with specific sectors of the economy.
You can type directly into this dropdown to search for specific sectors, which filters the options as you type.
5. Industry Dropdown This dropdown allows you to select specific NAICS-classified industries based on your sector filter (if applied).
Select a specific industry to visualize data for that particular economic sector. The options in this dropdown are filtered based on the selection in the Filter by Sector dropdown and the available data for the current indicator.
You can type directly into this dropdown to search for specific industry names or NAICS codes.
6. Show Components Checkbox When checked, this displays data for the selected industry alongside its immediate sub-industries.
Check this box to see how the selected industry's performance compares to its component parts. This provides insight into which sub-industries are driving the overall performance of the parent industry category.
7. Seasonally Adjusted Checkbox When checked, this displays seasonally adjusted data instead of raw data.
Check this box to view data that has been adjusted to remove predictable seasonal patterns, making it easier to observe underlying trends by eliminating regular seasonal fluctuations. For some series, this applies pre-existing seasonal adjustments calculated by the statistical agency; for others, it performs X-13-ARIMA-SEATS adjustment, a seasonal adjustment software produced, distributed, and maintained by the Census Bureau.
8. Show All Series Checkbox When checked, this displays all related series for the selected industry.
Check this box to see a more comprehensive set of series related to your selected industry. Unlike "Show Components" which shows immediate sub-industries, this option includes all sub-industries.
Data Transformation Panel
9. Index to Date Checkbox and Date Input When the checkbox is checked, the application will normalize all data to a specific date (set by the date input), setting the value on that date to 100.
Check the box to enable indexing, then select a reference date in the date input field. This is useful for comparing relative performance or changes across different industries or indicators from a common starting point, especially when the absolute values have different scales.
10. Transformation Dropdowns The application offers four types of transformations that can be applied to the data:
- Moving Average: Smooths data by calculating an average over a specified number of months
- Change: Shows absolute change over a specified period
- Percent Change: Shows percentage change over a specified period
- CAGR (Compound Annual Growth Rate): Shows annualized growth rate over a specified period
Select the desired transformation and period (3 months, 6 months, 12 months, etc.) to apply that transformation to the displayed data.
Data Management Panel
11. Chart Code Display and Input This section displays and allows you to input chart codes, which are compact encodings of all visualization parameters.
The displayed code represents your current visualization settings. You can copy this code to share with colleagues or save for future reference. To apply a previously saved chart code, paste it into the input field and click "Apply Chart Code."
12. Add to Multi-Series Viewer Button This button adds the currently displayed data series to the Multi-Series Viewer panel.
Click this button when you've configured a data series you want to include in your composite visualization. You can add multiple series to build comprehensive visualizations that compare different indicators, industries, or time periods.
13. Reset Inputs Button This button resets all inputs in the sidebar to their default values.
Click this button to start fresh with default settings if you want to begin a new analysis.
14. Download Current Data Button This button allows you to download the data currently displayed in the Data Browser as a CSV file.
Visualization Panel
15. Data Browser Chart The main chart displayed in the Data Browser section shows the data series based on all the selections and transformations applied through the sidebar controls.
This interactive visualization provides:
- Hover functionality to see exact data values
- Zoom capabilities using the range slider below the chart
- A legend to identify different data series
- Recession shading when enabled
This chart provides a preview of the data before adding it to the Multi-Series Viewer.
16. Data Information Box This information panel below the chart provides detailed context about the selected data:
- Recent readings (most recent, prior month, and year ago values)
- Proper citation format for the data
- Dataset description and source information
- Indicator methodology details
- NAICS industry description
Multi-Series Viewer Components
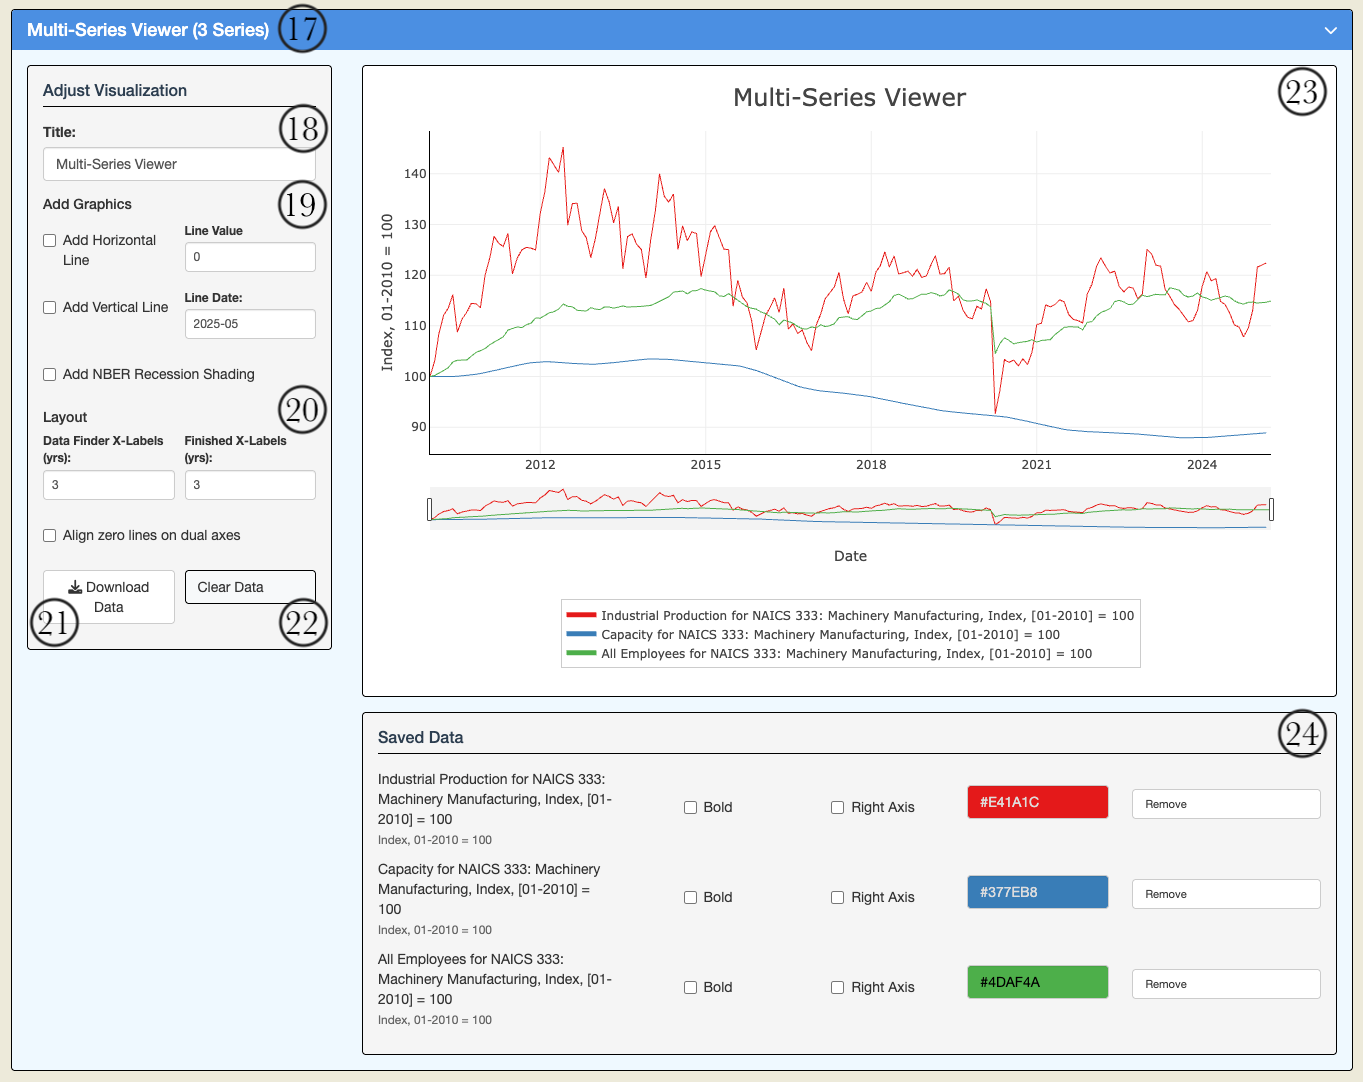
17. Multi-Series Viewer Panel Header This collapsible panel header shows how many series are currently in the Multi-Series Viewer. Click on this header to expand or collapse the Multi-Series Viewer section. The panel will show "(No Data)" if no series have been added or display the number of series otherwise.
18. Visualization Title Input This text input allows you to set a custom title for the Multi-Series Viewer visualization. This title will appear at the top of the Multi-Series Viewer chart.
19. Add Graphics Controls These controls allow you to add reference lines or shading to the visualization:
- Add Horizontal Line checkbox and value input: Adds a horizontal reference line at the specified value
- Add Vertical Line checkbox and date input: Adds a vertical reference line at the specified date
- Add NBER Recession Shading checkbox: Adds gray shading to indicate recession periods as defined by the National Bureau of Economic Research
These visual elements provide additional context and reference points for your analysis, such as target levels, significant dates, or economic cycle indicators.
20. Layout Controls These controls allow you to customize the layout of the charts:
- Multi-Series X-Labels: Determines the frequency of x-axis labels (in years) for the Multi-Series Viewer chart
- Align zero lines on dual axes: When checked, aligns the zero points on both the left and right y-axes for proper comparison between series with different scales
Adjust these values to improve the readability and appearance of the charts, especially when working with long time series or dual-axis visualizations.
21. Download Data Button This button allows you to download the data of all series in the Multi-Series Viewer as a CSV file.
22. Clear Data Button This button removes all series from the Multi-Series Viewer.
Click this button when you want to start a new visualization from scratch or remove all current series.
23. Multi-Series Viewer Chart This is the main chart showing all the data series that have been added to the Multi-Series Viewer.
Like the Data Browser chart, this visualization provides:
- Hover functionality to see exact data values
- Zoom capabilities using the range slider
- A legend to identify different data series
- Support for dual y-axes (left and right)
- Reference lines and recession shading when enabled
This chart represents your composite visualization that combines multiple data series, potentially from different datasets, indicators, or industries.
24. Series Manager This area displays a list of all data series that have been added to the Multi-Series Viewer, with controls for each series:
- Series name and units: Identifies each data series
- Bold checkbox: Makes the line for that series thicker in the chart for emphasis
- Right Axis checkbox: Moves the series to the right y-axis (useful for comparing series with different scales)
- Color picker: Allows customization of the series color
- Remove button: Removes that specific series from the visualization
Use these controls to customize the appearance of each data series in the Multi-Series Viewer, helping to create clearer and more informative visualizations that highlight the relationships most important to your analysis.
The North American Industrial Classification System
Census PDF of the 2022 NAICS Manual
Using the NAICS Manual to Interpret Economic Data
The North American Industry Classification System (NAICS) Manual is an essential resource for anyone seeking to understand the economic data presented in our Sectoral Economic Data Tool. This comprehensive reference document provides the detailed framework that organizes all economic activities into a logical, hierarchical structure that forms the backbone of our visualization platform.
By consulting the NAICS Manual, you'll be able to:
- Understand the precise definitions of each industry sector, subsector, and detailed industry code
- Identify which specific economic activities are included in (or excluded from) particular classifications
- Make more informed comparisons between related industry groups
- Better interpret the patterns you observe in the visualization tool
When using our data tool, you may notice interesting trends in a specific NAICS code like 333 (Machinery Manufacturing). The manual allows you to explore the exact boundaries of this category, understand its component industries (like 3331 - Agriculture, Construction, and Mining Machinery Manufacturing), and recognize how these classifications relate to actual business establishments in the economy.
To ensure the relevance, accuracy, and timeliness of the classification, NAICS is reviewed every five years to determine what, if any, changes are required. The next revision to NAICS codes will be released in January 2027.
A Brief History of NAICS
The North American Industry Classification System represents the culmination of decades of effort to create a coherent framework for understanding economic activity. The system's roots stretch back to 1937, when the Central Statistical Board established an Interdepartmental Committee on Industrial Classification "to develop a plan of classification of various types of statistical data by industries and to promote the general adoption of such classification as the standard classification of the Federal Government." This initiative resulted in the first Standard Industrial Classification (SIC) for the United States, with manufacturing industries classified by 1938 and nonmanufacturing following in 1939.
For over five decades, the SIC system served as the foundation for organizing economic data, undergoing periodic revisions to reflect the changing industrial landscape. However, by the early 1990s, rapid transformations in both domestic and global economies had rendered the SIC increasingly inadequate. The system struggled to account for emerging industries, particularly in the service sector, and lacked the flexibility to capture the growing complexity of modern economic activity.
In response to these challenges, the Office of Management and Budget established the Economic Classification Policy Committee (ECPC) in 1992, commissioning a "fresh slate" examination of economic classifications. This initiative eventually expanded into a trilateral effort with Mexico's Instituto Nacional de Estadística y Geografía and Statistics Canada, resulting in the development of NAICS. This new system, first implemented in 1997 and revised every five years since, replaced the outdated classification frameworks in all three countries.
What sets NAICS apart from previous systems is its production-oriented conceptual framework. Rather than simply grouping products or services, NAICS organizes establishments based on the similarity of their production processes—the actual methods used to transform inputs into outputs. This approach recognizes that an industry is not merely a collection of products but a grouping of producing units that share common economic characteristics.
The production-oriented foundation of NAICS enables policymakers and analysts to conduct more sophisticated economic analyses. By grouping establishments that use similar production technologies, the system facilitates meaningful comparisons of productivity, input usage, and technological change across time and between regions. This capability has become increasingly critical in our era of complex global supply chains, where understanding the linkages between sectors can illuminate vulnerabilities, opportunities, and competitive dynamics that might otherwise remain obscured.
The hierarchical structure of NAICS—organizing all economic activities into 20 sectors, then subdividing them into increasingly detailed subsectors, industry groups, and industries—provides analytical flexibility. Analysts can examine broad economic trends at the sector level while also drilling down to investigate the specific dynamics of narrowly defined industries. This multi-level perspective is invaluable for policymakers seeking to design targeted interventions that address the distinct needs of different economic segments.
By providing a common language for economic analysis across North America, NAICS has also enhanced international comparability of statistical data. While maintaining compatibility with the United Nations' International Standard Industrial Classification of All Economic Activities (ISIC) at broad levels, NAICS offers greater detail and precision for analyzing North American economies, striking a balance between international standardization and regional specificity. The system's regular revision process also ensures it remains responsive to emerging industries and changing production methods, maintaining its relevance as the economy evolves.
For researchers, business strategists, and policymakers alike, mastering the NAICS framework opens new possibilities for understanding economic structure and change. By moving beyond aggregate statistics to explore sectoral dynamics, these stakeholders can develop more nuanced perspectives on competitiveness, investment opportunities, workforce needs, and policy impacts.