Our data application brings together disparate economic indicators under a consistent organizational framework, allowing users to examine different economic sectors using standardized analytical tools. This integration allows researchers, policymakers, and business analysts to track relationships between different parts of the economy using comparable metrics, making it easier to identify patterns, correlations, and potential causal relationships across the economic landscape.
The economic indicators in this application originate from different government agencies and were developed for different purposes, often unrelated to each other. For example, employment data from the Bureau of Labor Statistics serves labor market monitoring purposes, while industrial production metrics from the Federal Reserve gauge manufacturing activity, and trade statistics from the Census Bureau track international commerce. These indicators differ in their collection methodologies, sampling techniques, seasonal adjustment procedures, revision schedules, and underlying definitions.
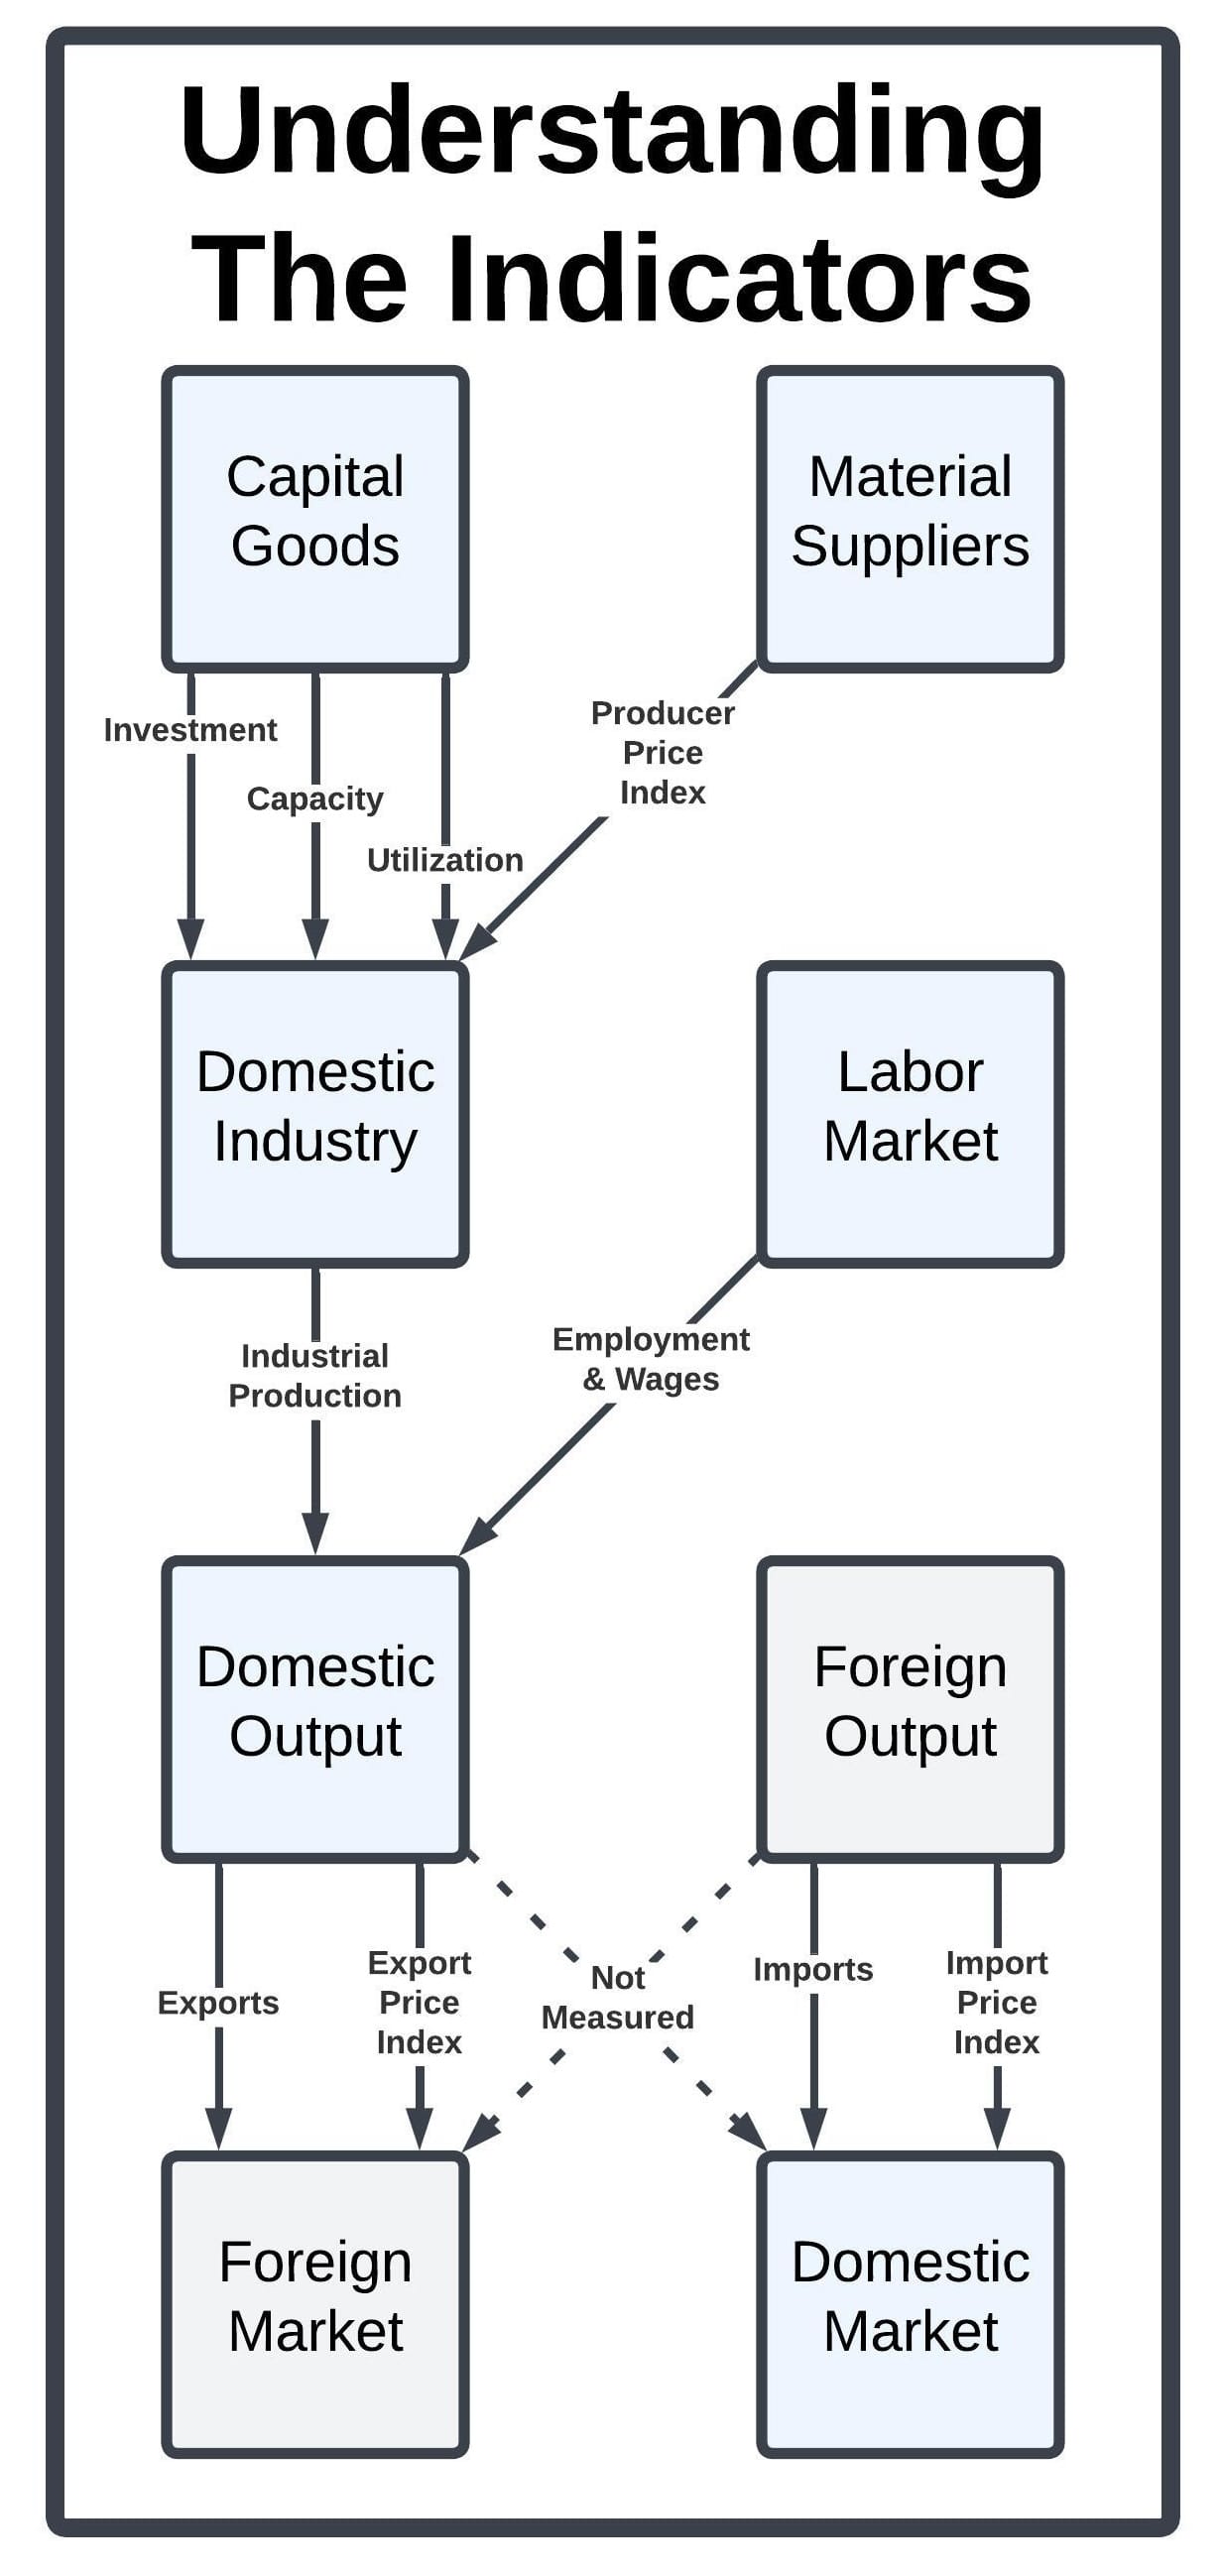
Economic Flows Between Sectors
Most of these indicators represent flows of economic activity between specific sectors. Understanding these flows is crucial for comprehending how different parts of the economy interact and influence each other. For instance, the indicators help track:
- How materials and components flow from suppliers to manufacturers
- How labor inputs contribute to production processes
- How finished products move to domestic and international markets
- How investment in equipment and structures affects production capacity
By analyzing these flows, users can develop a dynamic understanding of economic relationships rather than viewing sectors as isolated entities.
Key Indicator Categories and Their Significance
These indicators form an interconnected network that allows users to trace economic activity from investment and production through to final sales in domestic and international markets, providing a comprehensive view of economic dynamics.
Capital Goods
- Investment measures track expenditures on structures and equipment that expand productive capacity
- Capacity represents the maximum sustainable output level under normal conditions
- Utilization shows how much of available capacity is currently being used, indicating potential for expansion
Material Suppliers
- Producer Price Index (PPI) tracks price changes at the producer level, serving as an early inflation indicator
Domestic Industry
- Industrial Production measures real physical output across manufacturing, mining, and utilities
- Capacity Utilization indicates how much of existing production capability is being employed
- Inventory measures across various stages (materials, work-in-process, finished goods) reflect production pipeline health
Labor Market
- Employment metrics track workforce size across different categories (all employees, production workers, women)
- Hours worked indicate labor input intensity and often serve as leading indicators of hiring/firing decisions
- Earnings data measure compensation trends and purchasing power
Domestic Output
- Value of Shipments represents the dollar value of goods leaving manufacturing establishments
- New Orders signal future production commitments
- Unfilled Orders show production backlogs and future activity
Foreign Trade Flows
- Exports and Imports measure the value of goods crossing U.S. borders
- Trade Balance shows the net position between exports and imports
- Price indexes for imports and exports help convert nominal trade values to real volumes
Price Adjustment Mechanisms
- Import Price Index (IPI) tracks price changes of goods entering the U.S.
- Export Price Index (EPI) measures price changes of U.S. goods sold abroad
- Producer Price Index (PPI) captures price changes at the production stage
Data Sources
International Trade
Census International Trade data is accessible through the U.S. Census Bureau's main Foreign Trade portal. For NAICS-specific trade information, users can access the NAICS Index or use USA Trade Online for detailed NAICS-organized data. Documentation on methodology is available through the International Trade Statistical Program description, International Trade Definitions, and the Guide to International Trade Datasets. Developers can utilize the International Trade API to access Monthly U.S. Exports and Imports by NAICS classification.
Production and Capacity
For comprehensive information about the G.17 Industrial Production dataset, you can access the main G.17 page which serves as the top-level menu. For citation documentation and detailed information, refer to the explanatory notes, the Data Download Program, and the FRED page with citation format. Technical documentation is available through resources on industrial production methodology, capacity utilization methodology, and source and description tables.
Price Indices
The Bureau of Labor Statistics (BLS) produces a complementary set of key economic indicators through its Producer Price Index (PPI) and International Price Program (IPP) which includes both Import and Export Price Indices. These three major price indices work together to provide a comprehensive view of price movements throughout the U.S. economy and its international trade relationships. The PPI measures price changes from domestic producers' perspective, tracking inflation pressures before they reach the consumer level, while the Import and Export Price Indices track price changes in goods and services traded between the U.S. and foreign countries. All three indices share similar methodological foundations—using representative baskets of goods and services, matched-item pricing, and detailed classification systems—but focus on different economic domains. Together, they serve critical functions in economic analysis: deflating components of GDP, adjusting contracts for inflation, measuring terms of trade, analyzing exchange rate effects, assessing industrial competitiveness, and providing early signals of inflation trends. Users can access detailed methodology documentation, download customized datasets, and view the latest releases and analyses through the BLS website.
Current Employment Statistics
For comprehensive access to the Current Employment Statistics (CES) dataset, users can explore the main CES program page and the dedicated CES data portal. Detailed methodological information is available in the BLS Handbook of Methods with specific concepts explained in the concepts documentation. Technical aspects of the survey and benchmarking procedures are covered in the technical notes. Researchers requiring data extraction can utilize the various data access tools, while answers to common technical questions can be found in the FAQ section. Monthly releases and analytical publications are available through the publications page, providing the most current economic indicators derived from this survey.
M3 Manufacturers Shipments, Inventories & Orders
For comprehensive information on the Census M3 Manufacturers' Survey, visit the main M3 page where you can access detailed documentation including survey methodology, key definitions, and data collection procedures. The FRED database provides formatted data series with standard citation formats. For the most current data, refer to the Monthly Advance Report and Monthly Full Report. The survey is conducted under the authority of Title 13 United States Code, Sections 131, 182, and 193.
Investment
The Bureau of Economic Analysis provides comprehensive access to National Income and Product Accounts through its main NIPA tables page and Interactive Data Application. For more detailed investment data, researchers can access the Underlying Detail Tables page or the machine-readable quarterly data text file. To understand the methodology behind these statistics, the NIPA Handbook offers comprehensive documentation, with Chapter 6 specifically detailing Private Fixed Investment concepts and methods. When citing BEA data in technical documentation, researchers should follow the official Guidelines for Citing BEA to ensure proper attribution of these valuable economic indicators.